Editor & Debugging

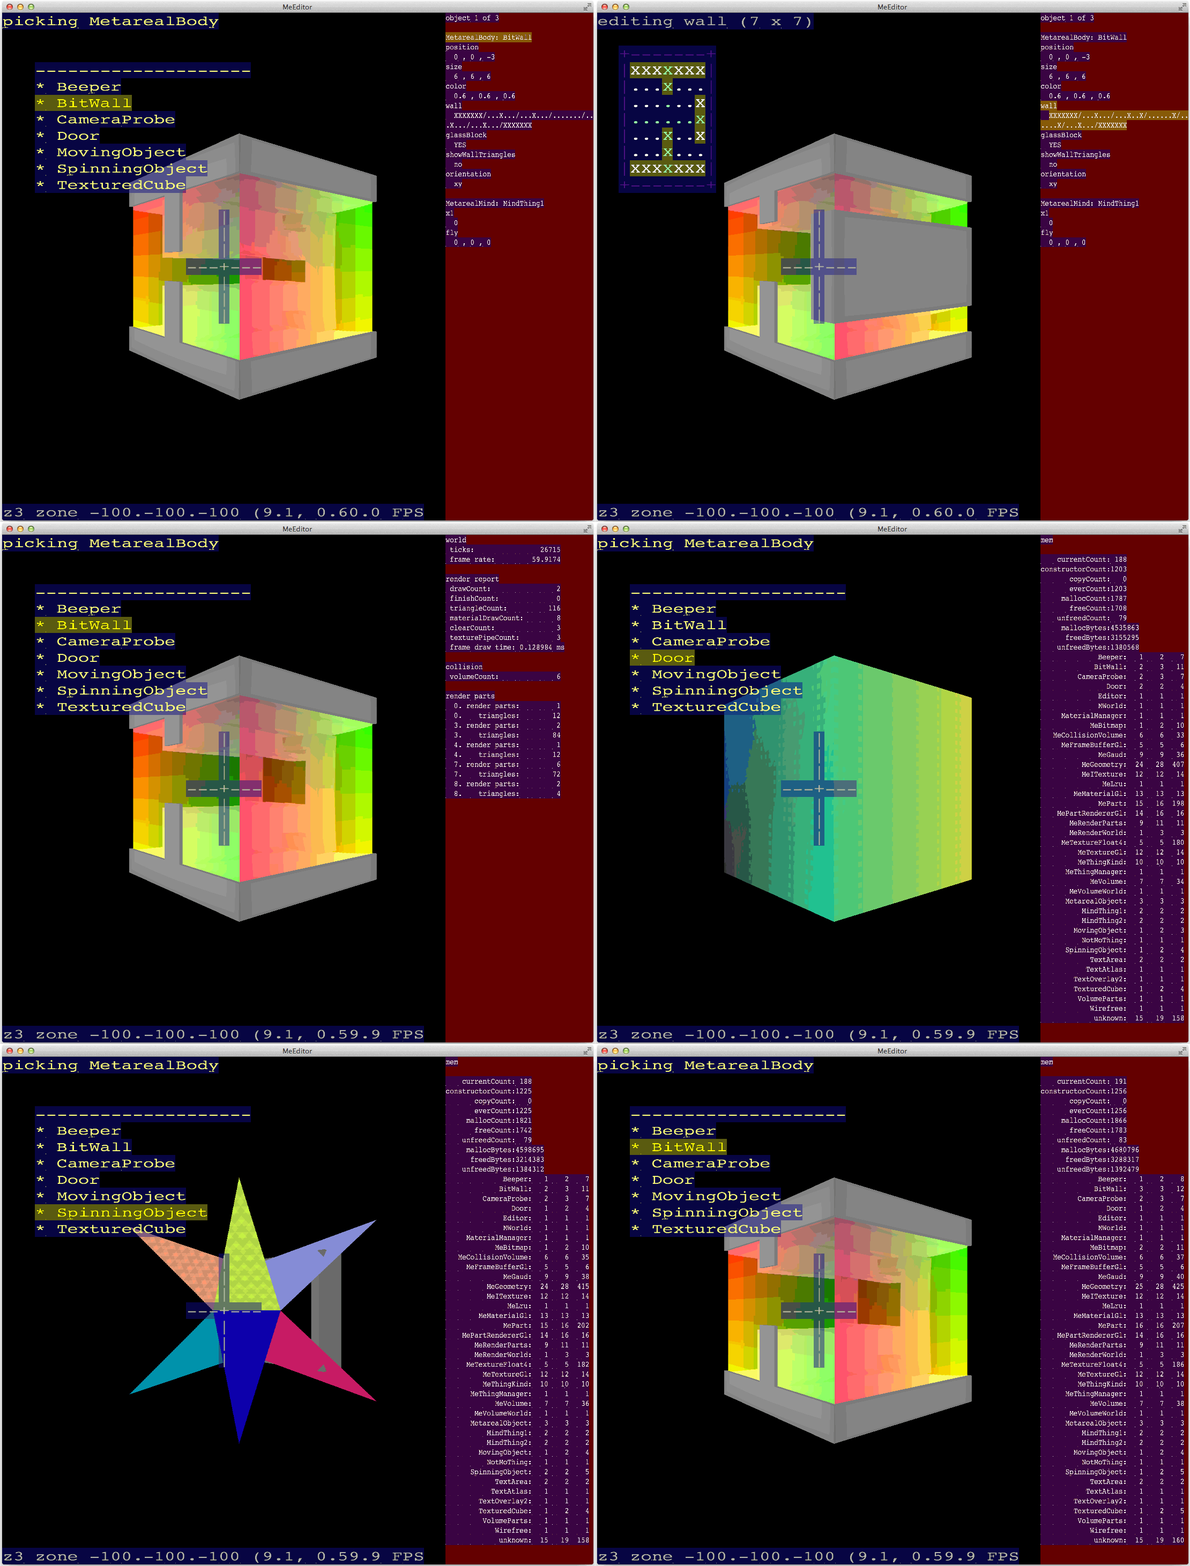
Just a quick reveal of the Editor, and some ways it helps development.

This whole project is ad hoc, bespoke, and DIY. Optimizing time, features, and function is mandatory. To this end, the Game and the Editor are one and the same. The Editor features will be disabled for a release build, but that’s just a detail.

The Editor features are for editing, certainly, but also for debugging and visibility. Below is an animation showing

  • parameter editing, including a bitmap editor,
  • object type changing,
  • and memory checking, confirming that edit operations don’t leak.

(Click it to go big.)

Beginnings of Culling

Both my laptop and my desktop seemed relatively happy with 1,000,000 triangles per frame, in several materials. And the entire world will probably come in around 750,000 triangles. So that’s great!

Except…

Not everyone has hardware from 2014 and 2015. And, anyway, for certain optical effects I need to do between 3 and 5 renders per frame. So, can’t just render the whole world every frame.

So I’ve started adding culling to the engine. Here’s a quick test where couple of hundred parts (individual object meshes) are hidden and shown per frame. Managing those lists can be expensive, but it can be easily trickled out across multiple frames as needed.

Sadly, QuickTime Player screen capture is somewhat low-quality. Seeking better screen capture solution…

Moments in Coding

You know what is scary? I will tell you a thing that is scary.

When you perform a somewhat spanning refactor —

Well let me back up a moment. I have a general approach to coding, and other things, which goes like this:

  • Charge ahead, make some progress without worrying too much about long-term consequences.
  • Step back and look at the results.
  • Now I am an expert. An expert on one very very tiny field of knowledge, but one that is immediately applicable to my needs…
  • Double back to step one, and revisit it. It may feel like “not making progress”… but with experience you know that certain things really do lead to long-term benefits. Eat your vegetables and whole grains, kid.

The scope of these revisitations varies. Sometimes I’ll bang out a solution, say, Hooray, and revert my files to do it again in the same hour. Other times I’ll go back a month later and refactor while keeping tests passing.

Where were we. Yes, earlier this week I was revisiting the base class for all Metareal objects (some would call them “game objects”). After spinning up the editor, and implementing four or five of them, I had a pretty good idea of what the life cycle should be, and a better idea of the distribution of responsibilities between World, Level, Editor, and Object.

When I started banging out the code, I didn’t really even have those names. The Level object was handling some world duties, and some Editor duties. And the Editor was handling SDL events directly, and so on. What they now reboiled down to is:

  • Editor. One of several possible top level apps. Instantiates a Level and a World. Gets first crack at UI events, passes them to the World sometimes.
  • World. Owns the list of objects. Owns the Level (after Editor loads it and gives it to the World). Responds to ticks, and owns the renderer.
  • Level. Turns files into object lists, and vice versa.
  • Object. Receives in-world events like player-touches and ticks and messages. May have renderable portions, or volume or collision presence. Has some “Editor-only” affordances like debug-info messages, getTriangleCount().

Nothing too radical, but took a little while to settle into this orderly form. So this refactor I was doing, I had a pretty clear idea, and some notes, and I dug into it. Lots of temporary ifdef-ing, and new unit tests along the way. Which brings us to the posting topic.

The thing that is Scary

Sometimes a thing is scary. It makes me question the plausibility of this whole endeavor. A person can’t write a big computer program… it can’t be done!

Mccoy

After laying out all the parts on the workbench, and 15 hours of coding, iterating, testing, everything was working again, looking good. Except the CPU and frame rate were all wrong. Previously, I could run a million triangles and fifty thousand collision zones at 12% and 60 FPS. But now it was slogging. The CPU was erratic. 15%. 45%. Debugger break, go, and back to 20%. And the frame rate would zoom to 60 (Hooray!) and then stumble to 38 (Wafna! Wafna!).

I ran the old version on a laptop side by side. The performance counters all matched reasonably: the same amount of “work” was being done, as expected. The memory footprint was comparable. Still no memory leaks.

But I had rejiggered quite a bit. What had changed? I kept profiling and iterating. Nothing. How could this be??

Illusion

Finally I rolled back to the previous version on the same computer… and saw that the old version also was behaving all wrong. Then I ran some other games, and they were terrible.

A reboot fixed everything. The refactor had worked just fine.

I’ll close with a small observation, to keep handy in special moment of confusion. (For example, the day before shipping when half the subsystems suddenly fail, and the test server breaks, and and and…)

The inexplicable usually involves a coincidence.

Testing & Debugging Miscellanea

Here’s a quick peek into some of the test and debug strategae I’m using…

Base Object

One of the great hazards of C++ is object leaks. To mitigate this, I have a base object that everyone descends from, called MeObjectBase. My descendant object constructors all look like

MeRenderWorld::MeRenderWorld(int width, int height) : MeObjectBase("MeRenderWorld")
{ ... }

Then we can print a tally of current objects by type name. But all that text-dictionary lookup can be expensive! So there’s a global boolean to enable or disable count-by-name. Even when disabled, the total number of objects is tracked.

Malloc

Like object leaks, memory leaks are alway looming. The main code never calls malloc or free directly. Instead, some wrappers are used which keep a tally of how much memory has been allocated and freed, and how many pointers have been allocated and freed. A few bytes at the beginning of the block hold the size. These static methods on MeObjectBase.

class MeObjectBase
{
public:
      ...    
    static void *malloc(size_t bytes);
    static void reallocAt(void **ptr, size_t bytes);
    static void freeAt(void **ptr);
};

Unit Testing

I’ve been coding since I was 12. That’s forty years now, but who’s counting. The only significant thing I’ve learned in the last twenty or so is the joy and beauty of organized unit tests. I used to do unit tests, without realizing it: I’d write some code at the top of main() to call the new function, print out the result, and quit. Then I’d delete the test and continue development.

I’ve also often written little test apps alongside my “real app” to exercise libraries.

Anyway, yeah, unit testing. For Metareal, I’m just running a small command line app that tallies up trues and falses and prints the result at the end.

Why not use an existing C++ unit testing framework? No great reasons, but among them: Tends to run slower as files are scanned or preprocessed for tests, adds code I don’t know that well. On the other hand, testing frameworks typically let you run single tests if needed. And I have to explicitly add every test function to main(). Oh well, is a tradeoff.

Here’s what some tests look like:

// A typical "main method" for a test file
void allMatrixTests()
{
    castingFloatToVec4();
    vec4ToVec3Tests();
    matrixRowColumnExtracts();
    matrixTests();
    matrixTestWTranslate();
    matrixTestLTranslate();
    vectorCallTest();
    basicMatrixMathFun();
}

// A typical assertion
    float m03 = m4(0,3);
    ASSERT_EQUALS_FLOAT("col/row", 3, m03);

// Implementation of one of the assertions
#define ASSERT_EQUALS_INT(_message,_want,_got) assertEqualsInt(1,__LINE__,_message,#_want,#_got,(long long)_want,(long long)_got)
void assertEqualsInt(int sayIt,int line,cc message,cc wantS,cc gotS,long long want,long long got)
{
    g.assertions++;
    if(got == want)
    {
        g.passes++;
    }
    else
    {
        g.fails++;
        assertLogFail("%6d. FAIL %4d %s %s(%lld) != %s(%d)\n",g.fails,line,message,wantS,want,gotS,got);
    }
}

The last assertion I make is that all the memory and objects have been freed. Here’s a happy output.


    currentCount:   0
constructorCount:3801
       copyCount:   0
       everCount:3801
     mallocCount:6249
       freeCount:6249
    unfreedCount:   0
     mallocBytes:2363449281
      freedBytes:2363449281
    unfreedBytes:   0
         BitmapThing:   0    2    3
                Ham1:   0    1    1
             IfThing:   0    2    6
            IxMover2:   0    2    8
   MeCollisionVolume:   0   10  134
              MeGaud:   0    3   34
          MeGeometry:   0 1001 1541
               MeHam:   0    1    1
          MeITexture:   0    4   81
               MeLru:   0    2    3
              MePart:   0 1000 1190
       MeRenderParts:   0    3   59
       MeRenderWorld:   0    1   19
      MeTextureAtlas:   0    2   23
     MeTextureFloat4:   0    3   22
         MeThingKind:   0    1    8
      MeThingManager:   0    1    4
            MeVolume:   0  128  493
       MeVolumeWorld:   0    1   25
     MockFrameBuffer:   0    2   10
        MockMaterial:   0    3   67
        MockRenderer:   0    3   28
                   a:   0    3    3
                   b:   0    1    1
             unknown:   0    3   37
     0.  ok       undisposed objects 0(0) == MeObjectBase::currentCount(0)
     0.  ok       undisposed mallocs 0(0) == MeObjectBase::mallocCount - MeObjectBase::freeCount(0)
test results: 7551 pass / 7551 assertions (0.686 seconds)
---------------------
 aok
---------------------
Program ended with exit code: 0

Thing to notice: the total runtime for these tests is about a second. It covers the math, part and triangle-list management, many, many collision and volume intersection cases. It does not cover actual, live OpenGL code.

Debug Logging

Little to say here, I have a couple of log methods, which take arguments like printf. Listeners can be added.

Debug Global Booleans

Aaah, yes, debugging realtime code can be tricky. To help, when running the realtime app I map control-0 through control-9 directly to ten globally accessible booleans. Sometimes I’ll add some code to a deep, inner function which does something special based on those booleans. Then I can trigger it at will while running. Works nicely with breakpoints.

Well, Ok

That’s just some of the goodies in play.

Performance Check

I’ve been watching the CPU continuously during development. The Metareal World has many moving parts, and I want them all to keep moving, all the time.

Here’s 15000 cubes all orbiting a black hole. They do not affect each other.

15000cubies

That took 80% CPU on a modern Mac Pro desktop. Most of that time is uploading the 15000 new position in a texture for use by the vertex shader.

Here’s some other measurements so far:

  • Animate 15000 cubes: 80% CPU
  • Draw 1000000 triangles (500000 triangles in the scene, from two angles): 60 FPS
  • Draw more than 1000000 triangles: FPS drops fast!
  • Draw rates on Mac Pro Retina Notebook 2013: about the same
  • Draw rates on an iMac 2010: about 30 FPS… choppy… sad.
  • Collision resolution among 47000 AABBs, 900 of which are moving: 10% CPU
  • Collision resolution same, on Mac Pro Retina Notebook 2013: 20% CPU

Looks like my work is cut out: need to draw as few triangles as possible!

Fortunately, I have a robust system for managing volume intersections. It is the foundation for the collision detection and resolution. It will also be used to detect various kinds of triggers, such as passing through a zone to activate a thing, and also for placing a key in a slot. This volume manager should be quite usable as a culling system, as well.

The render management presently supports add and delete parts; it could be extended with show and hide.

The policy could be based on visibility zones established for which rooms can see each other. Or it could be coarser solution, such as a general radius from the camera, extending generally across the sight line. A frustum could be approximated with several AABBs, and a maximum view distance could be imposed, as if the world is murky. (This might even work well with some of the remote-camera-based puzzles…)

More to come.